
BuildPulse: Real-Time Structural Health Monitoring for Safer, Longer-Lasting Infrastructure
- Aug 10, 2025
- 10 min read

BuildPulse is an IoT-based Structural Health Monitoring (SHM) platform from Naexo Consulting, a Ghosh Group company, that turns raw structural response into decisions like what changed, where, how fast, and what to do next. From bridges and viaducts to chimneys and heritage buildings, BuildPulse gives owners, EPCs, and operators real-time visibility, predictive alerts, and defensible evidence for maintenance and budgets.
Why SHM, and why now?
India is upgrading its infrastructure at scale developing highways, metro corridors, elevated flyovers, river bridges, industrial facilities, and resilient buildings. The engineering challenge has shifted from “Can we build it?” to “Can we operate it safely, reliably, and cost-effectively for decades?” Traditional methods like periodic visual inspections, occasional non-destructive testing, and reactive maintenance are necessary but often insufficient. They are episodic; small degradations can hide between inspection cycles and emerge as downtime, speed restrictions, or avoidable failures.
Structural Health Monitoring closes that gap. SHM continuously measures how a structure behaves under real loads and real environments. It captures trends, flags anomalies, and helps answer five practical questions that every owner asks:
Is the structure safe to operate today?
What is changing, where, and how quickly?
What explains the change of temperature, traffic, settlement, corrosion, or something else?
What is the most cost-effective intervention right now?
How much life is realistically left before major rehabilitation?
BuildPulse is Naexo Consulting’s answer to these questions: an end-to-end, India-ready SHM system designed to be technically rigorous, operationally reliable, and straightforward to procure and run.
What BuildPulse is (and what it is not)
BuildPulse is a productized SHM solution that combines sensors, industrial gateways, secure communications, a data platform, analytics, and user applications. It is not a single “black box.” It’s a layered architecture with clearly defined responsibilities:
Sensing: strain, acceleration, displacement, tilt, crack width, temperature/humidity, and where needed, corrosion indicators, fiber Bragg grating (FBG), or acoustic emission.
Edge computing: local quality checks, time synchronization, buffering, and feature extraction.
Communications: cellular (4G/NB-IoT), LoRaWAN, or ethernet; satellite in remote corridors.
Cloud/on-prem platform: time-series ingestion, high-rate event storage, analytics, and alerting.
Applications: dashboards, GIS/digital-twin overlays, report builders, and APIs into SCADA/BIM/CMMS.
Service model: turnkey installation, calibration, 24×7 monitoring, SLA-backed availability, and periodic engineering reports.
BuildPulse augments routine inspections; it doesn’t replace engineering judgment or statutory checks. Think of it as always-on instrumentation plus analytics that keeps the structural narrative continuous, not episodic.
The sensing strategy: measuring what matters
A robust SHM system doesn’t “sprinkle sensors.” It places the right sensors at the right locations, with the right sampling rates, to track the failure modes that actually drive risk.
Strain gauges (electrical or vibrating-wire): quantify stress, stiffness change, and long-term creep/shrinkage in RC and steel members.
Accelerometers (MEMS for long-term, IEPE for campaigns): extract natural frequencies, damping, and mode shapes to detect stiffness loss or abnormal impacts.
Displacement sensors (LVDT/laser): track mid-span deflection, bearing movement, and expansion joint behavior.
Tiltmeters/inclinometers: measure pier/column rotation and settlement-induced rotations.
Crack width sensors: monitor crack growth rate; vital for serviceability and durability decisions.
Environment packs: temperature/humidity to decouple thermal effects from mechanical behavior.
Corrosion indicators: half-cell potentials or LPR where corrosion risk is a driver.
Advanced options: FBG arrays for distributed strain/temperature over long members, acoustic emission for active cracking in cables and anchorages, and GNSS for mm-level displacement on tall/long structures in campaign mode.
Sampling and trigger logic:
Vibration streams typically run at 10–200 Hz (lower for routine tracking, higher during diagnostic campaigns).
Slow channels (strain, tilt, cracks, temperature) run between 1 Hz and one value per minute, with event-based bursts if thresholds are crossed.
Gateways buffer days of data to ride through power or network disruptions.
For students: imagine each sensor as a “stethoscope” listening to a different organ of the structure. The edge gateway is the triage nurse cleaning, labeling, and prioritizing signals before the analytics team makes the diagnosis.
Edge-to-Cloud data flow: from raw signals to reliable alerts
1) Field Devices → DAQ: Sensors connect to data acquisition modules with proper signal conditioning (bridge amplifiers, anti-alias filters). Enclosures are IP65–IP67, UV-stable, and earthed.
2) Edge Gateway:
Multi-protocol (RS-485/Modbus, TCP, CAN, LoRa, Ethernet).
Time sync via GNSS/NTP; watchdogs for unattended operation.
First-pass analytics: filtering, feature extraction (e.g., RMS acceleration, peaks, frequency bands), data quality flags, and event tagging.
3) Communications and Security:
Primary 4G/LTE or NB-IoT; LoRaWAN for long-reach, low-power points; Ethernet where available; VSAT where nothing else works.
Mutual TLS, device certificates, signed firmware, and rotated keys. Optional VPN tunnels to on-prem data centers.
4) Platform:
Time-series database for high-ingest routine data.
Object storage for raw high-rate bursts (impacts, earthquakes, load tests).
Stream processors implement persistence/hysteresis so alerts are about real change—not noise.
Analytics services run modal identification, thermal compensation, anomaly detection, fatigue estimation, and rule-based checks.
5) Applications:
Dashboards provide a portfolio view of assets, drill-downs to elements, and per-sensor trends.
Digital twin overlay places sensor health on 3D geometry (IFC/Revit).
API connectors write work orders into CMMS (Maximo/SAP PM/Infor) and expose read-only tags to SCADA via OPC UA/MQTT.
Report composer packages monthly operations and quarterly engineering assessments with charts, thresholds, and management summaries.
Analytics you can trust: descriptive, diagnostic, predictive
Good SHM analytics separate signal from context. Temperature swings, traffic variability, and wind can look like damage if you ignore them. BuildPulse is engineered to explain before it alarms.
Descriptive & QC
De-trending and filtering remove sensor drift and electrical noise.
Thermal-strain separation uses regression and physics-informed models so “hot afternoons” don’t masquerade as damage.
Demand/response normalization accounts for traffic, weather, or operational regimes.
Diagnostic
Operational Modal Analysis (OMA): identifies natural frequencies, damping, and mode shapes from ambient vibrations. Persistent frequency shifts or MAC/COMAC divergences can indicate localized stiffness loss or connection issues.
Deflection envelopes: mid-span deflections are checked against temperature-normalized baselines and span-to-depth ratios.
Crack growth: trend analysis turns weekly micrometer changes into actionable risk.
Corrosion risk indexing: combines potentials, moisture proxies, and cover to prioritize locations for NDT.
Predictive & Prescriptive
Anomaly detection: multivariate thresholds with persistence windows; ML models (e.g., isolation forest or autoencoder trained on “healthy” periods) flag subtle changes.
Fatigue estimation: rainflow counting of strain ranges and Miner’s rule for cumulative damage in steel; RC checks for repeated service loads.
Residual capacity estimation: model-updating aligns simplified FE behavior with measured response.
Action logic: alerts are tiered into Info, Advisory, Action, Critical with recommended next steps, from targeted inspection to slow orders or temporary shoring.
For experts: BuildPulse supports SHM Levels 1–4 (detection to prognosis) when data sufficiency and modeling fidelity are available. For students: think of Levels 1–4 as “Is there damage?” → “Where?” → “How severe?” → “How long before it matters?”
Integration with BIM, SCADA, and enterprise maintenance
SHM must live where operations live. BuildPulse integrates on three fronts:
BIM/Digital Twin: Sensor tags are bound to model elements (IFC/Revit). Heatmaps and trend widgets appear on the geometry, helping engineers visualize “hot spots” without hunting through point lists.
SCADA/Control Rooms: Read-only tags flow into the OCC via OPC UA/MQTT for metro/plant environments. Critical alerts show up alongside existing alarms, with links back to context in the BuildPulse UI.
CMMS: Actionable alerts generate work orders with asset IDs, location, snapshot plots, and recommended tasks. Closing a work order feeds learning back into the analytics.
Cybersecurity, data governance, and ownership
BuildPulse follows industrial cybersecurity principles i.e. secure boot, signed firmware, mutual TLS, RBAC with SSO/SAML, and audit logs for every alert acknowledgment and threshold change. Indian data residency and on-prem deployments are supported if a public client or strategic asset demands it. Ownership is simple: the client owns the data and Naexo provides secure access, APIs, and export formats (CSV/Parquet/IFC links).
Deployment methodology: India-ready, field-proven
Pre-Implementation (Weeks 0–2)
Engineering survey, drawing review, risk assessment, and instrumentation plan aligned to asset constraints (traffic blocks, river works, heritage facades).
Method statements and EHS plans; BoQ and acceptance criteria frozen with the owner’s engineer.
Installation & Commissioning (Weeks 3–10)
Corrosion-protected mounts, UV-stable conduits, labeled terminations, surge protection, and proper earthing.
Power strategy: mains plus UPS/surge; or solar + LiFePO4 where grid is unreliable.
Commissioning checks: channel-wise validation, time sync verification, and SAT sign-off.
Baseline & Model Update (Weeks 11–12)
Controlled measurements (ambient or load) establish the “healthy” fingerprint.
Optional FE model update for higher-fidelity diagnostics.
Operations (Steady State)
24×7 monitoring, alert triage, monthly ops reports, quarterly engineering reviews, and annual life-cycle planning sessions.
Calibrations and spares strategy documented and tracked under SLA.
Use-case playbooks
Urban flyover with adjacent construction
Objective: track deck vibration, bearing behavior, and pier tilt while metro works proceed nearby.
Sensors: accelerometers on key spans, tiltmeters on piers, displacement at expansion joints, temperature/humidity pack.
Outcome: one bearing begins to bind; advisory becomes action as persistence triggers. Targeted maintenance normalizes deflection without full closure.
Long-span river bridge with heavy axle loads
Objective: monitor joint movement, mid-span deflection, and deck dynamics under trucks.
Approach: distributed FBG strain lines on critical girders, displacement sensors at joints, tilt chains on two piers.
Outcome: seasonal envelope defined; out-of-band joint behavior detected in pre-monsoon weeks; replacement scheduled during low-demand window.
Industrial stack and equipment platform
Objective: manage wind-induced vibration, thermal-cycle effects, and crack behavior.
Approach: tiltmeters, accelerometers, temperature chains, and crack sensors; SCADA read-only tags at the control room.
Outcome: damping retrofit and clamp maintenance prioritized ahead of monsoon winds.
Heritage structure near excavation
Objective: low-intrusion protective monitoring for settlement and cracking.
Approach: thin-profile crack gauges, tiltmeters, discreet cabling, frequent reports to architect/regulator.
Outcome: excavation dewatering tuned in response to trends; heritage fabric preserved.
Economics and ROI: how SHM pays for itself
Cost drivers: sensor count and type, access complexity (river, rail, height), power/solar kits, data rates, and analytics depth. Value drivers: avoided closures, targeted maintenance, reduced emergency works, and life extension of critical elements.
A simple frame: if BuildPulse prevents even one unplanned closure or emergency retrofit per year on a major corridor, the avoided social and direct costs often exceed the annualized cost of the monitoring program. On industrial sites, fewer forced outages and better evidence for planned shutdowns deliver similar paybacks. Most owners see tangible benefits within the first operating year; more mature portfolios track three-year reductions in emergency spend and traffic disruptions.
Commercial models:
CAPEX + AMC: client owns hardware; Naexo delivers analytics and maintenance under SLAs.
OPEX subscription (Monitoring-as-a-Service): minimal upfront; monthly fee covers hardware, connectivity, analytics, and reporting.
Hybrid: durable sensors as CAPEX, gateways and analytics as OPEX.
Compliance orientation and procurement readiness
BuildPulse is designed to operate alongside Indian standards commonly used by owners and designers, such as IS 456 (RC), IS 800 (steel), IS 1893 (seismic), and IRC provisions for bridges and loadings. On the operations side, BuildPulse provides the documentation public clients expect: method statements, HIRA/EHS plans, FAT/SAT checklists, calibration certificates (NABL-traceable where applicable), data acceptance criteria, and training manuals. The platform exports open formats and supports read-only integration into SCADA and read/write integration with CMMS.
For procurement teams, we provide specimen BoQ lines, performance clauses (e.g., ≥99.5% data availability on critical channels; alert delivery within minutes for Action/Critical), and deliverables lists for easy inclusion in tender documents or EPC scopes.
Risk management and limitations (and how BuildPulse addresses them)
Sensor drift or failure: redundant sensing at critical points, scheduled recalibration, and automated drift detection in software.
Connectivity issues: store-and-forward at edge gateways, dual-SIM strategies, and alternate backhauls where required.
False positives/negatives: multi-sensor correlation, contextual filters (temperature/traffic), and alert persistence windows.
Access and safety constraints: night blocks, rope access, marine safety plans, and heritage-friendly mounting methods.
Data overload: persona-based dashboards (executive, asset manager, engineer) keep the signal-to-noise ratio high.
Model risk: where prognosis is model-dependent, BuildPulse shows confidence intervals and keeps “what the data says” visibly separate from “what the model infers.”
Sustainability and ESG alignment
Monitoring reduces wasteful blanket maintenance, enables targeted interventions, and lowers travel footprints through remote diagnostics. Solar + LiFePO4 power kits support off-grid sites. Durable mounts and UV-stable conduits reduce e-waste and rework. From an ESG standpoint, SHM is a practical instrument: safer assets, fewer emergency closures, and transparent reporting to communities and regulators.
Roadmap: what’s next for BuildPulse
Computer vision assist: camera-based deflection and crack tracking in controlled conditions; drone photogrammetry for facades.
Bayesian digital twin updating: tighter residual capacity estimates by fusing measurements with FE models.
Load-to-response analytics: pairing Weigh-in-Motion data with structural response to understand demand envelopes more precisely.
Portfolio risk dashboards: cross-asset heatmaps for network-level planning.
Edge AI: more on-device inference to reduce bandwidth and catch fast transients.
Who benefits and how to start
Owners and public agencies get continuous, evidence-based visibility, leading indicators of risk, and cleaner justification for budgets. EPCs get clarity during construction/defects-liability, and a path to data-driven handover. O&M teams get fewer surprises and better prioritization. Students and young engineers get a laboratory on the real world: how structures actually behave.
Starting is simple: pick one critical structure, define the questions that matter (deflection, bearing health, tilt, vibration), deploy a targeted sensor kit, and set clear acceptance criteria. The first quarter establishes baselines; the first year delivers measurable operational value.
Conclusion
BuildPulse makes SHM practical. It listens to structures continuously, explains what is changing and why, and translates that into decisions that reduce risk and cost. The engineering depth sits under a straightforward operating model i.e. install once, monitor continuously, act early. For a country investing heavily in physical infrastructure, that combination matters. Safer assets, fewer disruptions, and longer useful life aren’t slogans; they are outcomes that BuildPulse can measure and deliver.


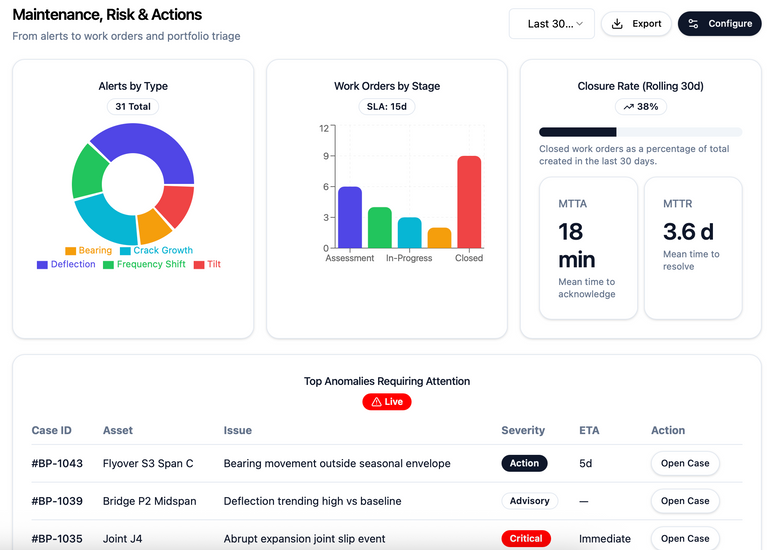


Sample Dashboards
Frequently Asked Questions (SHM, BuildPulse, and Deployment)
1) What exactly is Structural Health Monitoring (SHM)?
SHM is the continuous measurement and analysis of structural response—strain, vibration, deflection, tilt, crack growth, and environmental factors—to assess condition, detect changes, and guide maintenance. Unlike periodic inspections, SHM keeps the narrative continuous and quantifiable.
2) How is BuildPulse different from data loggers with a dashboard?
BuildPulse is a full stack: purpose-built sensors, edge QA and buffering, secure comms, a high-ingest data platform, analytics (modal ID, anomaly detection, fatigue), tiered alerts with persistence, digital-twin overlays, and CMMS/SCADA connectors—plus SLAs, reports, and field service. It’s an operating system for structural monitoring, not just a charting tool.
3) Will SHM replace visual inspection or NDT?
No. SHM augments statutory inspection. It points inspectors to evolving hot spots, shortens diagnostic time, and provides data before and after NDT or repairs to validate outcomes.
4) What structures are the best candidates for BuildPulse?
Bridges and flyovers, metro viaducts, long-span river crossings, industrial stacks and pipe racks, critical buildings (hospitals, control centers), and heritage assets near construction. Start where consequence of failure or unplanned closure is high.
5) What if connectivity is unreliable on site?
Gateways store days of data and forward when links return. We use dual-SIM cellular, LoRaWAN for local links, ethernet where available, and satellite as a last resort. Alerts degrade gracefully with persistence and backfill intact.
6) How are thresholds set without flooding teams with alarms?
Thresholds begin with design values and commissioning baselines, then incorporate context (temperature/traffic) and persistence windows. Multi-sensor corroboration reduces false positives. Over the first quarter, thresholds are tuned with the owner’s engineer.
7) Who owns the data and how secure is it?
The client owns the data. BuildPulse uses device certificates, mutual TLS, signed firmware, RBAC with SSO/SAML, and full audit logs. Indian data residency or on-prem deployments are supported for strategic/public assets.
8) Can we integrate BuildPulse with our BIM model and maintenance system?
Yes. Sensors align to IFC/Revit elements for digital-twin views. Alerts can open work orders in CMMS (Maximo/SAP PM/Infor). SCADA integration uses OPC UA/MQTT for read-only visibility in control rooms.
9) How do we justify the ROI?
Quantify avoided closures, targeted maintenance (versus blanket works), fewer emergency call-outs, and life-extension benefits. On major assets, preventing a single unplanned shutdown or reactive retrofit can pay for an annual SHM program many times over.
10) What does a typical first project look like?
One critical structure, a focused sensor kit (e.g., accelerometers, displacement, tilt, and environment), clear acceptance criteria (data availability, alert latency), and a 12-month monitoring window with monthly ops and quarterly engineering reports. Baselines in the first month, measurable value within the first year.

After reading about the solution, it looks that it is very much needed for to be implemented across India for safer infrastructure projects.